

The Problem
Most small water utilities run on paper. Rolls of blueprints stacked in file cabinets. Field notes scribbled in notebooks. When a main breaks at 2 a.m., a crew drives to the office, pulls the right map from the drawer, and heads out with flashlights. It works. But it's slow, it's risky, and nobody knows what you've actually got buried under the street until you dig. Tracing underground pipes shouldn't require a trip back to the office.
Bigger utilities moved to GIS — geographic information systems — decades ago. Most of the folks we work with just call it "the map on the phone." But the tools felt too expensive, too complicated, and too much for a small team. So most of you never started.
Here's the thing: you don't need to be a 500-person utility to benefit from digital mapping. You need to know where your pipes are, how old they are, and what condition they're in. That's it. And you can start today.
We talk to utilities every week who are in this exact spot. "Paper and pencil drawn utility maps — that's what I have," one manager told us. Another said: "It's over here by this tree stump. Well, the tree's been gone for 10 years." If that sounds familiar, this guide is for you.

Step 1: Gather What You Already Have
Before you buy anything or hire anyone, walk through your office. What's in those file cabinets?
Look for:
- Blueprint rolls or PDFs of your system layout
- Construction records with pipe sizes and materials
- As-built drawings from major projects
- Leak history logs or break records
- Service maps marked up by field crews
- Any notes on valve locations, hydrant positions, or pump station layouts
Don't worry if the maps are old, incomplete, or hand-annotated. Digital GIS starts with whatever you have. Even a 1992 blueprint is useful — it's a starting point. Here's more on what GIS actually means for a small utility.
Photograph or scan everything. Store it in one folder. You now have your baseline.
Step 2: Pick a Base Map
You need a geographic foundation. Fortunately, this is free.
Use one of these:
- Google Maps or Google Earth (free, satellite view, easy to reference)
- USGS topographic maps (free, accurate, good for layout)
- Your county assessor's parcel data (often free, shows property lines and street boundaries)
Most GIS software lets you use these as your background map. Pick whichever one looks clearest for your town and you'll draw your pipes on top of it.
Step 3: Start Tracing Your Underground Pipes
This is the core work. Whether you're tracing underground pipes from old blueprints or marking new installations from the field, you're digitizing maps — converting paper lines into digital coordinates — digitizing your map so you can pull it up on a phone instead of a filing cabinet.
The straightforward way: Use free or low-cost utility mapping software:
- QGIS — Free and powerful, but the learning curve is steep. You'll need someone comfortable with GIS software.
- ArcGIS Online — Esri's web version ($50–300/month). Easier to use, but designed for bigger operations with dedicated GIS staff.
- Ziptility — Built specifically for small utilities that don't have a GIS person on staff. Your crew can use it on their phones in the field.
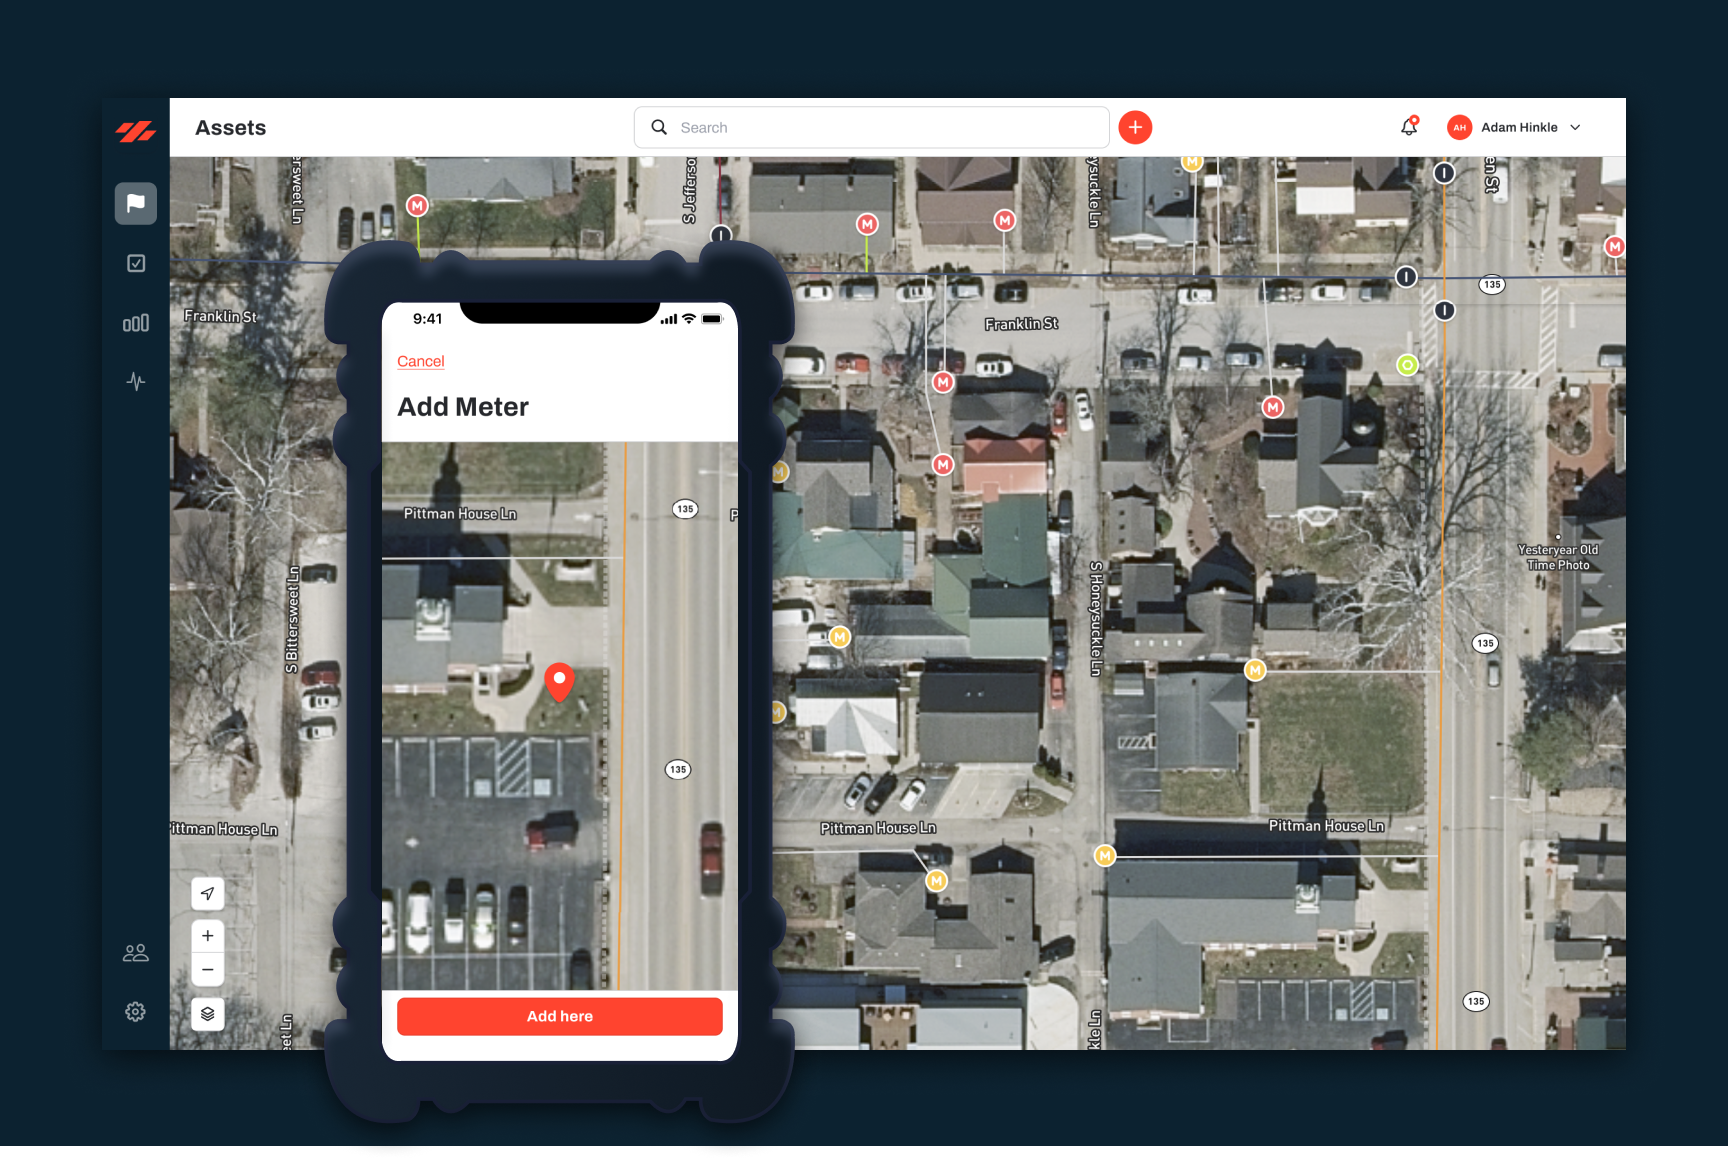
Open your base map. Pull up your scanned blueprints or PDFs alongside it. Start tracing underground pipes where you know they exist. Mark each line with the pipe size and material if your blueprints show it.
Priority first: Don't digitize everything at once. Start with your main transmission lines and the oldest neighborhoods where breaks happen most. A small utility might have 50–150 miles of pipe. Digitizing the critical 30 percent takes weeks, not years.
Step 4: Fill in the Details as You Go
As crews work in the field, they learn things the maps don't show. A valve that moved. A pipe that's actually 8-inch, not 6-inch. A connection nobody documented.
Create a simple process:
- Field crew notes the location and what they find
- Someone back at the office updates the digital map weekly or monthly
- Over time, your map gets more accurate
This isn't a one-and-done thing. Every time your crew finds something new — a valve that moved, a pipe that's different than what the blueprint says — the map gets better.
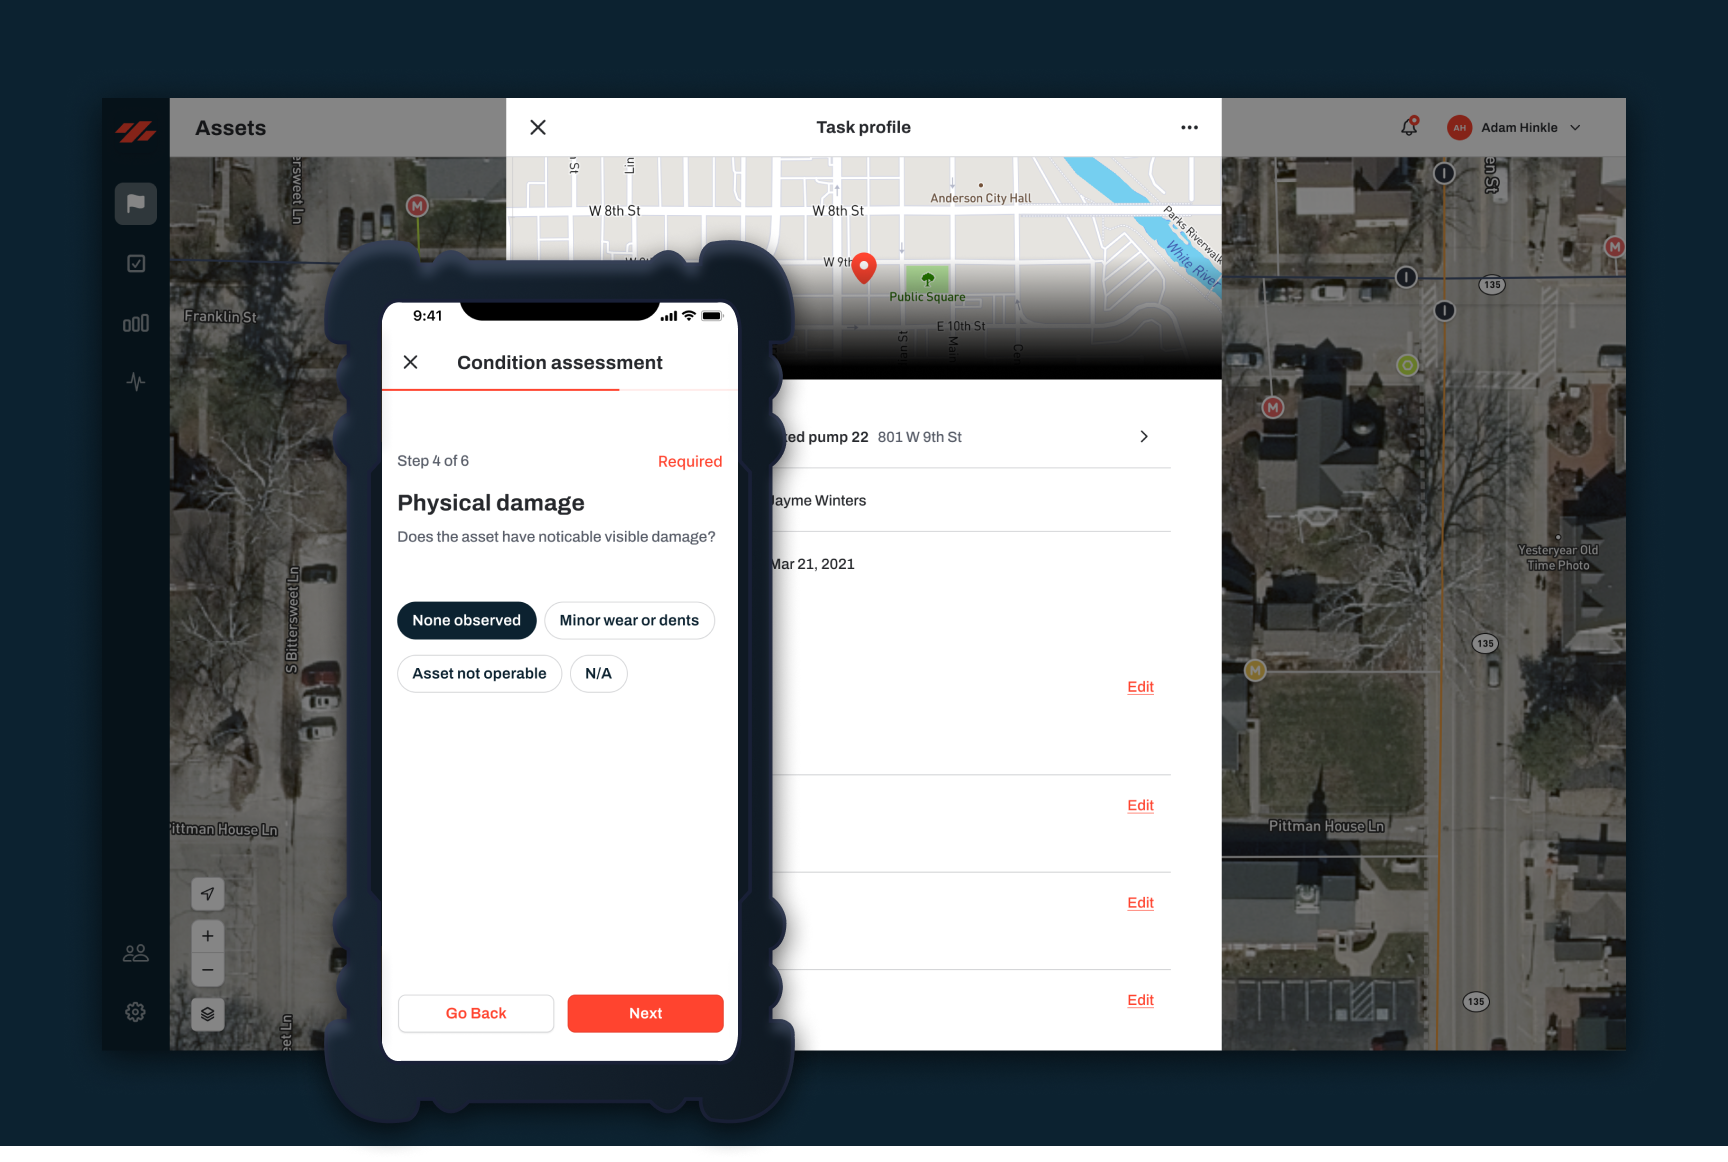
Step 5: Add Asset Condition Data
Once your pipes are mapped, start tracking their age and condition. This is where utility asset management starts to pay off.
Go through your records:
- When was each section installed?
- What material is it (PVC, ductile iron, asbestos cement)?
- Any recent breaks or leaks in that area?
- When was the last inspection?
Load this into your GIS. Color-code by age or material. Now you can see that the neighborhoods built in the 1960s have cast iron pipes that are starting to fail. You can see which areas have the most leaks. You can start prioritizing replacements instead of just reacting to breaks.
Step 6: Use the Map to Make Decisions
This is where GIS stops being busy work and starts paying for itself.
.png)
With your pipes mapped and condition data recorded, you can:
- Spot leak-prone areas: Which neighborhoods have the most breaks? Prioritize those for replacement.
- Plan projects: Need to replace 2 miles of pipe this year? Your map shows which sections are oldest and most critical.
- Respond faster: Main break at night? Crews pull up the digital map on their phones. They know what's around the break. They know the valve locations. They're on-site faster.
- Budget better: You can estimate replacement costs by age, material, and condition. That's way better than guessing.
- Track progress: You can see which parts of your system you've already upgraded and which still need work.
As one utility manager put it: "I just like the idea of being able to see my water lines all on one piece of paper and being able to zoom in on valves and hydrants." That's what this gives you.
Utilities that make this shift catch problems earlier and plan bigger projects instead of chasing fires. One customer told us: "I could just do this as I'm reading meters — half the town would be mapped just that fast." It doesn't take long before the map starts paying for itself.
How Long Does This Take?
For a small utility:
- Gathering existing records: 1–2 weeks
- Scanning and organizing: 1–2 weeks
- Initial pipe digitization: 4–12 weeks (depending on system size and complexity)
- Adding condition data: 2–4 weeks
- Getting useful decisions from it: Month 4 onward
You can do this with one part-time person. Or split it across your team. The total cost for software ranges from free (QGIS) to a few hundred dollars a month. No expensive consultants required.
Start Small, Build It Out
You don't need a perfect map on day one. You need a usable map that gets better over time.
Pick your most critical pipes. Get those digitized and in your hands. Use that map to make one smarter decision this quarter. Then add more pipes, more data, better tools. In a year, you'll have something that saves you time and money every single week.
The utilities that waited for perfect are still waiting. The ones that started rough and improved steady are already seeing the payoff.
Related: Already have GIS but your map and work orders don't talk to each other? Read why you need more than a mapping app. Worried about losing what your experienced operators know when they retire? Here's how to capture that knowledge. Looking at ESRI alternatives? Here's what small utilities are doing instead.
Ready to get off paper? We built Ziptility to make this doable for small systems — no GIS experience needed, no expensive consultants, no five-year implementation. We'll set it up using your actual data. Takes about 45 minutes to get started.
Start your free trial or see how the City of Anderson did it, or check what it costs for your system.
Related reading:
Paper Maps, Filing Cabinets, and the Monday Morning That Changes Everything →
