

Your newest board member asks at Tuesday’s meeting: “When was this section of pipe last inspected?”
Everyone goes quiet. Someone checks a spreadsheet. Someone else pulls up a map. Nobody has the answer.
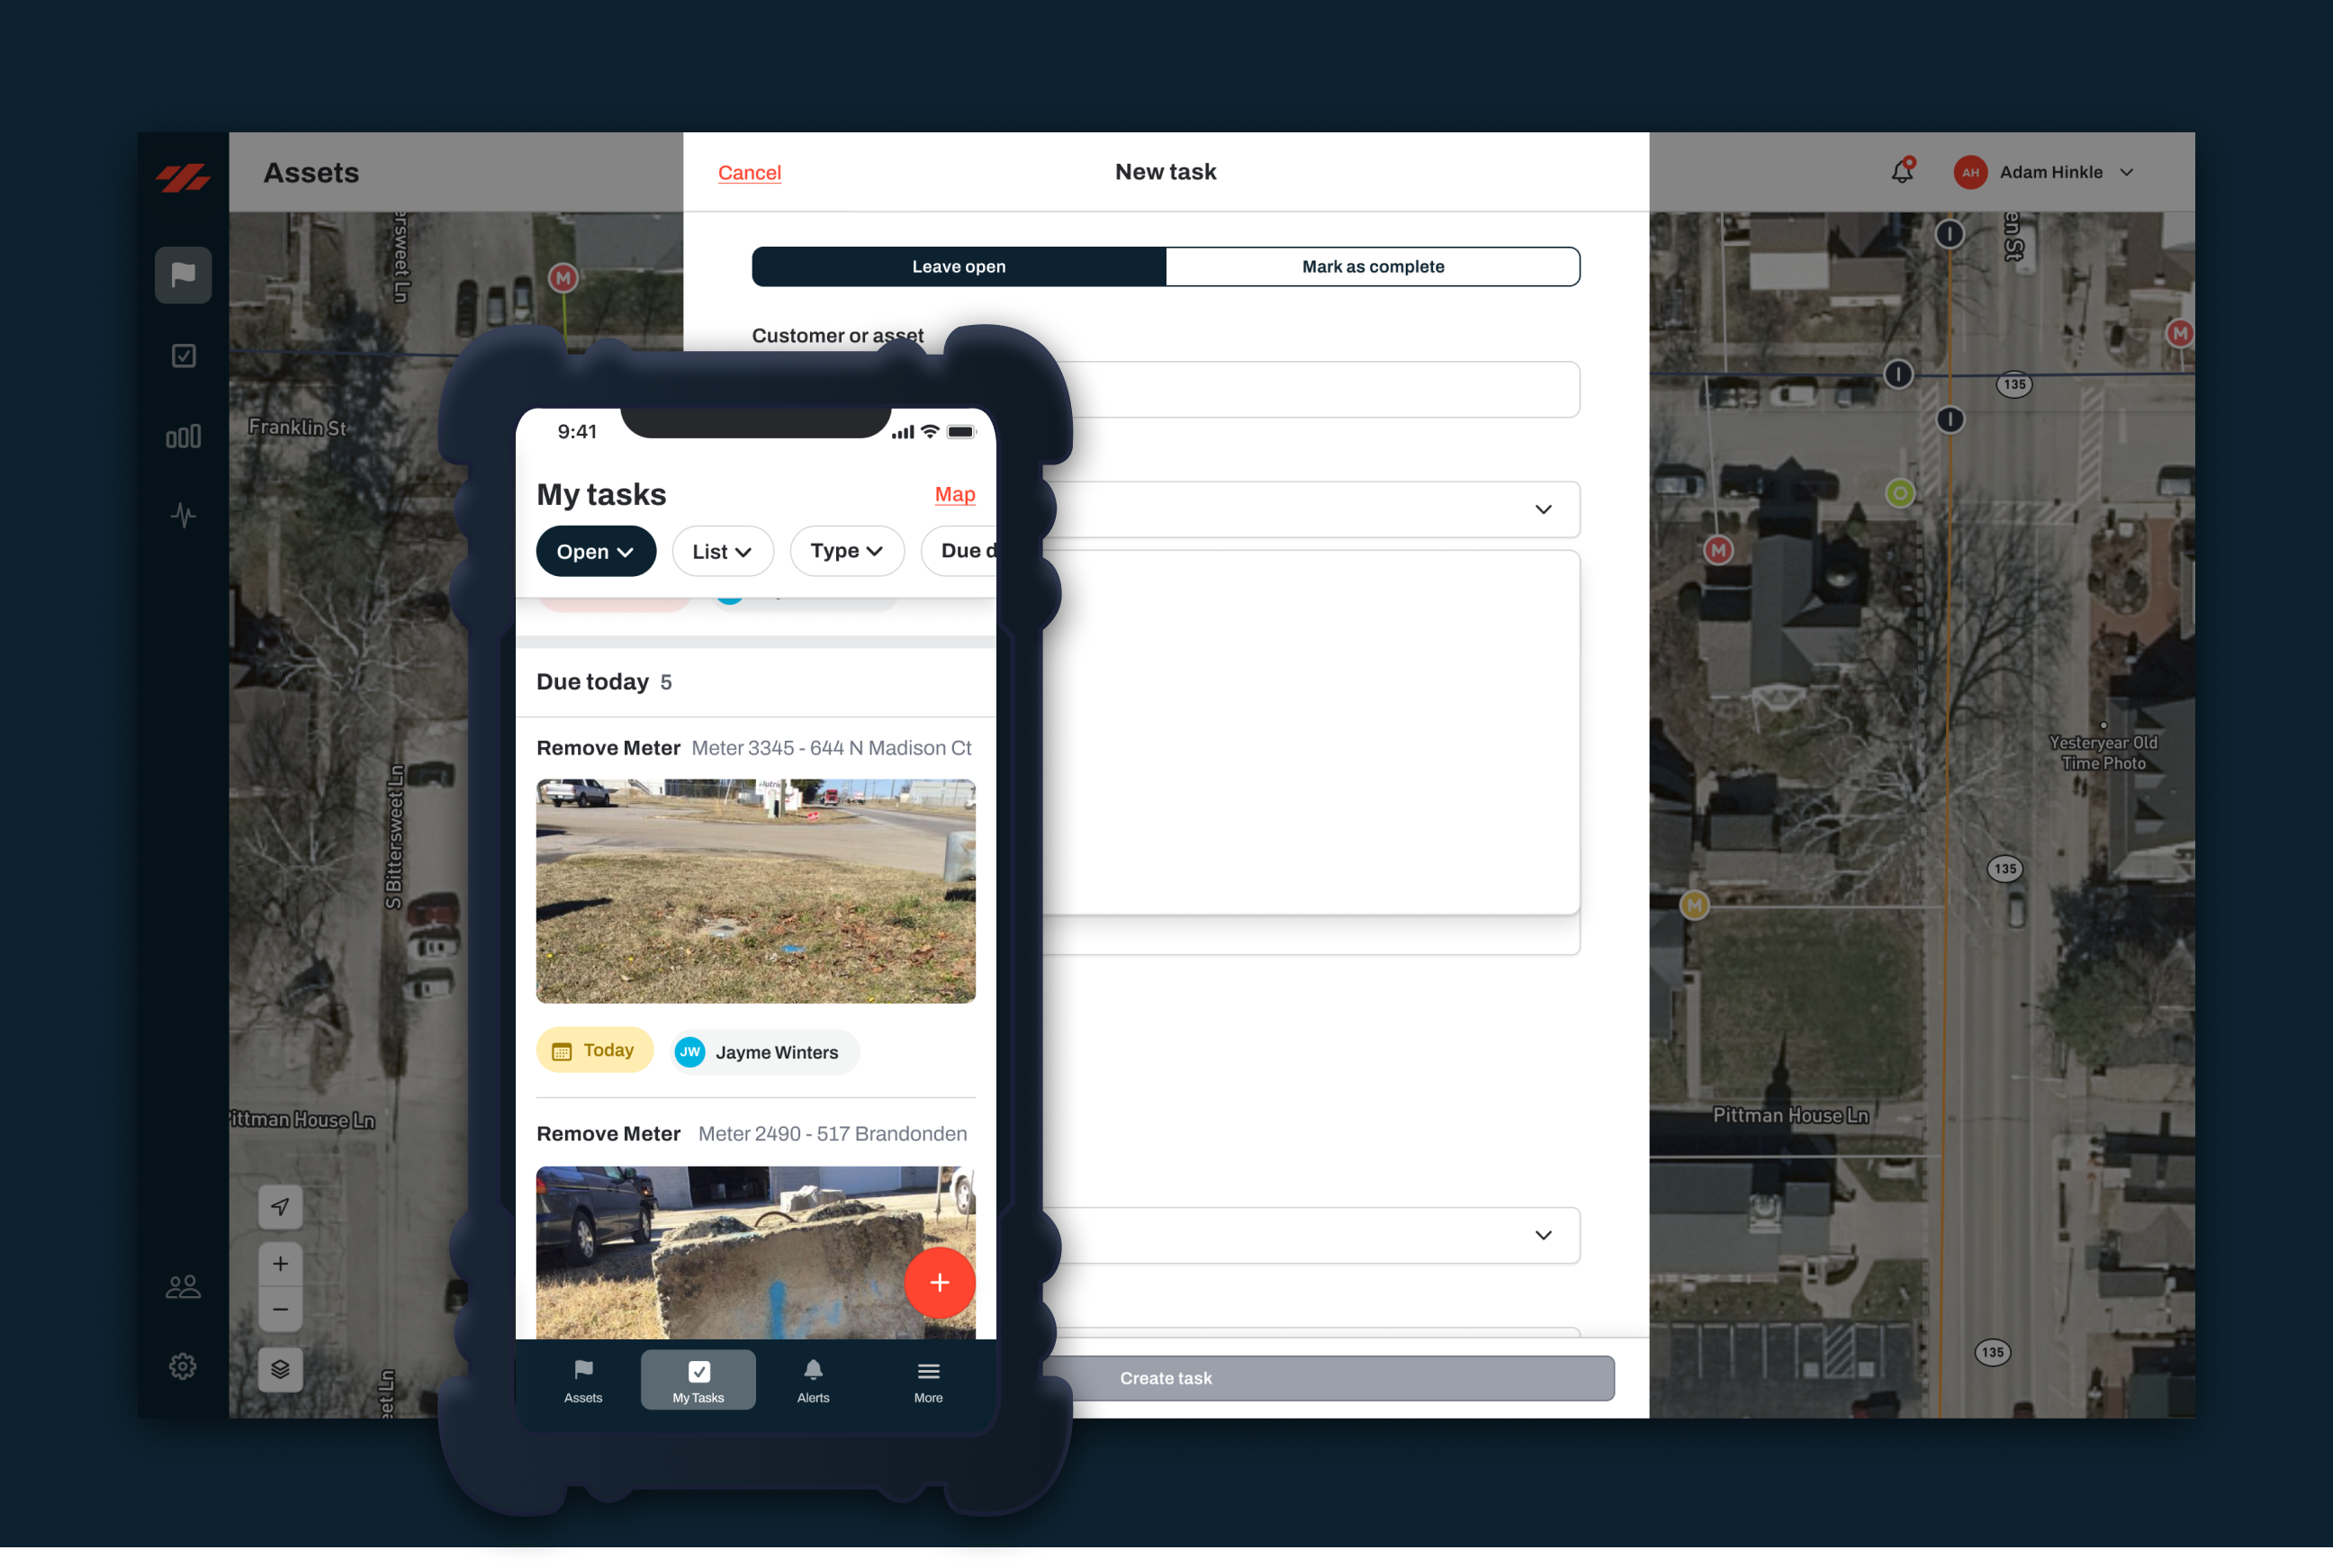
This silence is the real problem. A map tells you where things are. But utilities run on when and how and who and what happens next. That’s the work order side — tracking what was done, when, and by whom. Most utilities have a map or they track work orders. What they actually need is utility asset management software that does both — and most don’t know it exists.
The Map-Only Trap
A GIS utility mapping tool shows your pipes, assets, and infrastructure beautifully. You can color-code by age. You can layer in condition data. You can zoom to street level. It’s useful.
But here’s what it can’t do:
Scenario 1: Water main breaks at 2 a.m.
- Map tells you: there’s a main here, it’s 8-inch PVC from 1998, it runs under Maple Street
- Map doesn’t tell you: Who’s on-call tonight? Where’s the closest isolation valve? Did we order parts for this diameter? When was this section last worked on? What’s the history of breaks in this area?
You have to jump between systems. Someone pulls up a spreadsheet. Someone checks the work order log from last year. You lose 20 minutes finding what you already did.

Scenario 2: Your board asks for a rate justification
- Map tells you: here’s our infrastructure
- Map doesn’t tell you: which pipes are near end-of-life? How much work have we actually completed? What’s it going to cost to replace what needs replacing? How many failures are we preventing?
You’re rebuilding the story in PowerPoint instead of reading it from your system.
Scenario 3: A regulator audits your compliance
- Map tells you: your lead service line inventory
- Map doesn’t tell you: which properties have we inspected? Who did the inspection? When? What were the results? What work is pending?
You’re manually compiling a folder of documents instead of pulling a report.
Scenario 4: Your current operator retires
- Map tells you: here’s the system layout
- Map doesn’t tell you: how do we actually run this? What’s the pump schedule? What does high pressure mean? What’s the valve isolation sequence for a break? What patterns has this operator learned?
Your new operator is learning from scratch, and you lose institutional knowledge permanently.
We hear this constantly. One utility told us: “Preventative maintenance data is stored in Bernie’s brain.” Another said: “If that person was to ever move on to something different, well, we need to do meter reads... it’s going to be a struggle.”
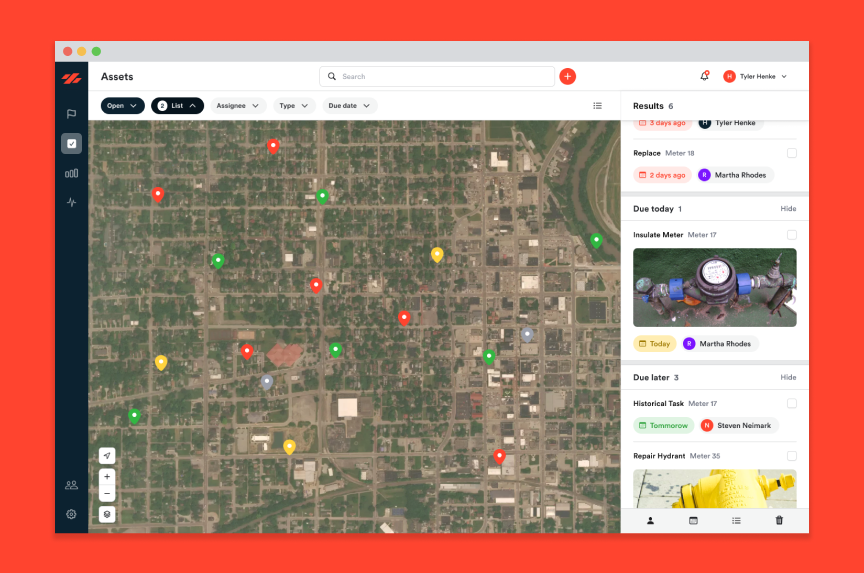
What Happens When Your Map and Your Work Orders Live in One Place
When your map and your work orders live in the same system, everything connects.
The same main break, now:
- Your crew opens one system, not three
- They see: the pipe location, its age and material, the closest valve, and the work history (what failed, when, how it was fixed)
- They see the crew they want on-call has done main breaks before. They know the protocol.
- The new work order is linked to the asset. Your historical data just got more complete.
One system. Real time. The whole picture.
The rate justification, now:
- You pull a report showing: 12 miles of pipe identified as priority replacement, 8 miles completed in the last 3 years, 4 miles remaining, average cost per mile, timeline based on funding
- You show: we’ve prevented 15 water loss events by upgrading the neighborhoods that kept breaking
- You add: here’s our 10-year replacement plan, what it’ll cost, and what that means for rates
- Your board isn’t guessing. They’re deciding based on real work.
The compliance audit, now:
- You pull a report: every lead service line inspected, by inspector, date, result
- You show: work orders issued, completion dates, before/after photos if applicable
- The auditor sees a managed system with a paper trail, not a folder of loose documents
- Your team knows what’s done and what’s pending. No detective work required.
The operator transition, now:
- Your new operator logs in and sees: here’s the asset map, and here’s every work order we’ve ever completed on it
- They can see patterns: when does the pressure drop? How do we respond? What’s worked before and what hasn’t?
- The retiring operator documents key procedures once, in the system, and it’s there for the next person
- You capture 30 years of knowledge instead of losing it on a Friday.
Why This Is So Hard to Find
If you’ve looked around, you’ve probably noticed most tools do one or the other. The big systems like CityWorks bolt mapping and work orders together, but they’re built for utilities with GIS departments and IT staff. As one utility manager told us about CityWorks: “It hasn’t turned out as I’d hoped.”
The simpler tools do mapping great but can’t track a work order. You end up with two logins, two databases, and your crew updating one but not the other. You spend time keeping two systems in sync instead of running your utility.
And when utilities try utility mapping software that doesn’t fit? “At the end of the day, it just didn’t work,” one superintendent in Kansas told us. We hear that a lot.
How Utility Asset Management Actually Works
Mapping isn’t complicated. You need to know where your assets are and what they are. That’s your foundation — your water asset management starting point.
Tracking work orders isn’t complicated either. You need to know what was done, when, and by whom. That’s your record.
The difference is when they talk to each other. When you close a work order, it shows up on the asset — no double entry, no copying it over. When you pull up an asset on the map, you see everything that’s ever been done to it. When you can pull a report for your board without rebuilding it from scratch in PowerPoint.
This isn’t theoretical. We work with small utilities — a few hundred connections to 10,000 — that run their maps and work orders out of one system every day. Their boards make decisions faster. Their operators get up to speed quicker. Their audits take hours instead of days.
Start Here
Related: If you’re still on paper, read our guide on getting from paper maps to digital GIS. Worried about losing what your experienced operators know? Here’s how to capture that knowledge before they retire. And if you’re wondering whether ESRI makes sense for your size, here’s what we’re seeing.
If you’re running on a map and a spreadsheet, you’re managing half your utility.
You need the asset map. You need the work orders. And you need them connected.
The good news: you don’t need a $100,000 enterprise system. You don’t need a five-year implementation. You don’t need a GIS department.
Ziptility puts your maps and your work orders in one place. It’s built for small utilities — not IT departments. Your data is yours, and you can export it anytime.
Want to see how it works for a system like yours? We’ll set up a trial with your actual data. Takes about 45 minutes to get started. Start your free trial or see how it works, or check what it costs for your system.
Related reading:
