Financial tracking: know which pipes are eating your budget, and make the case to fix them.
Financial tracking for water utilities: connect the dollars to the assets
Your accounting system knows how much money went out the door last year. It does not know which pipes ate it. The repairs are lumped under one line that says "maintenance." There is no way to tell the main that breaks every spring from the one you have not touched in twenty years.
That gap is why capital plans come from a guess. Financial tracking closes it. It ties every labor hour, every part, and every piece of equipment to the actual asset on the map. Here is how it works, where it fits, and the one thing it does not do.
The numbers here come from somewhere real: asset management is the record of what you own and what has been done to it.
Does this replace QuickBooks or my accounting software?
No, and you should not want it to.
Keep QuickBooks, Caselle, Springbrook, or your county software for what they are good at: revenue, payroll, fund balances, and the books. This does not do general-ledger accounting and is not trying to.
What it does is cost your infrastructure, the one thing the books cannot. They tell you that you spent $80,000 on repairs this year. They cannot tell you that $31,000 of it went into one stretch of 6-inch cast iron on the east side. That is the number that drives an infrastructure decision, and it lives here, tied to the asset, not in the general ledger.
How does the cost of a repair get tied to an asset?
When a crew member closes a work order, three costs roll up onto the asset automatically.
Nobody opens a spreadsheet. They close the job, and the math happens.
It holds up out where the signal does not. The job still logs on the phone and syncs when the truck gets bars back, and the costs roll up the same way.
Labor.
Each person on the crew has an hourly rate in the system. Log the hours on the task (Jon four hours, Alex six) and the labor cost calculates itself.
Materials.
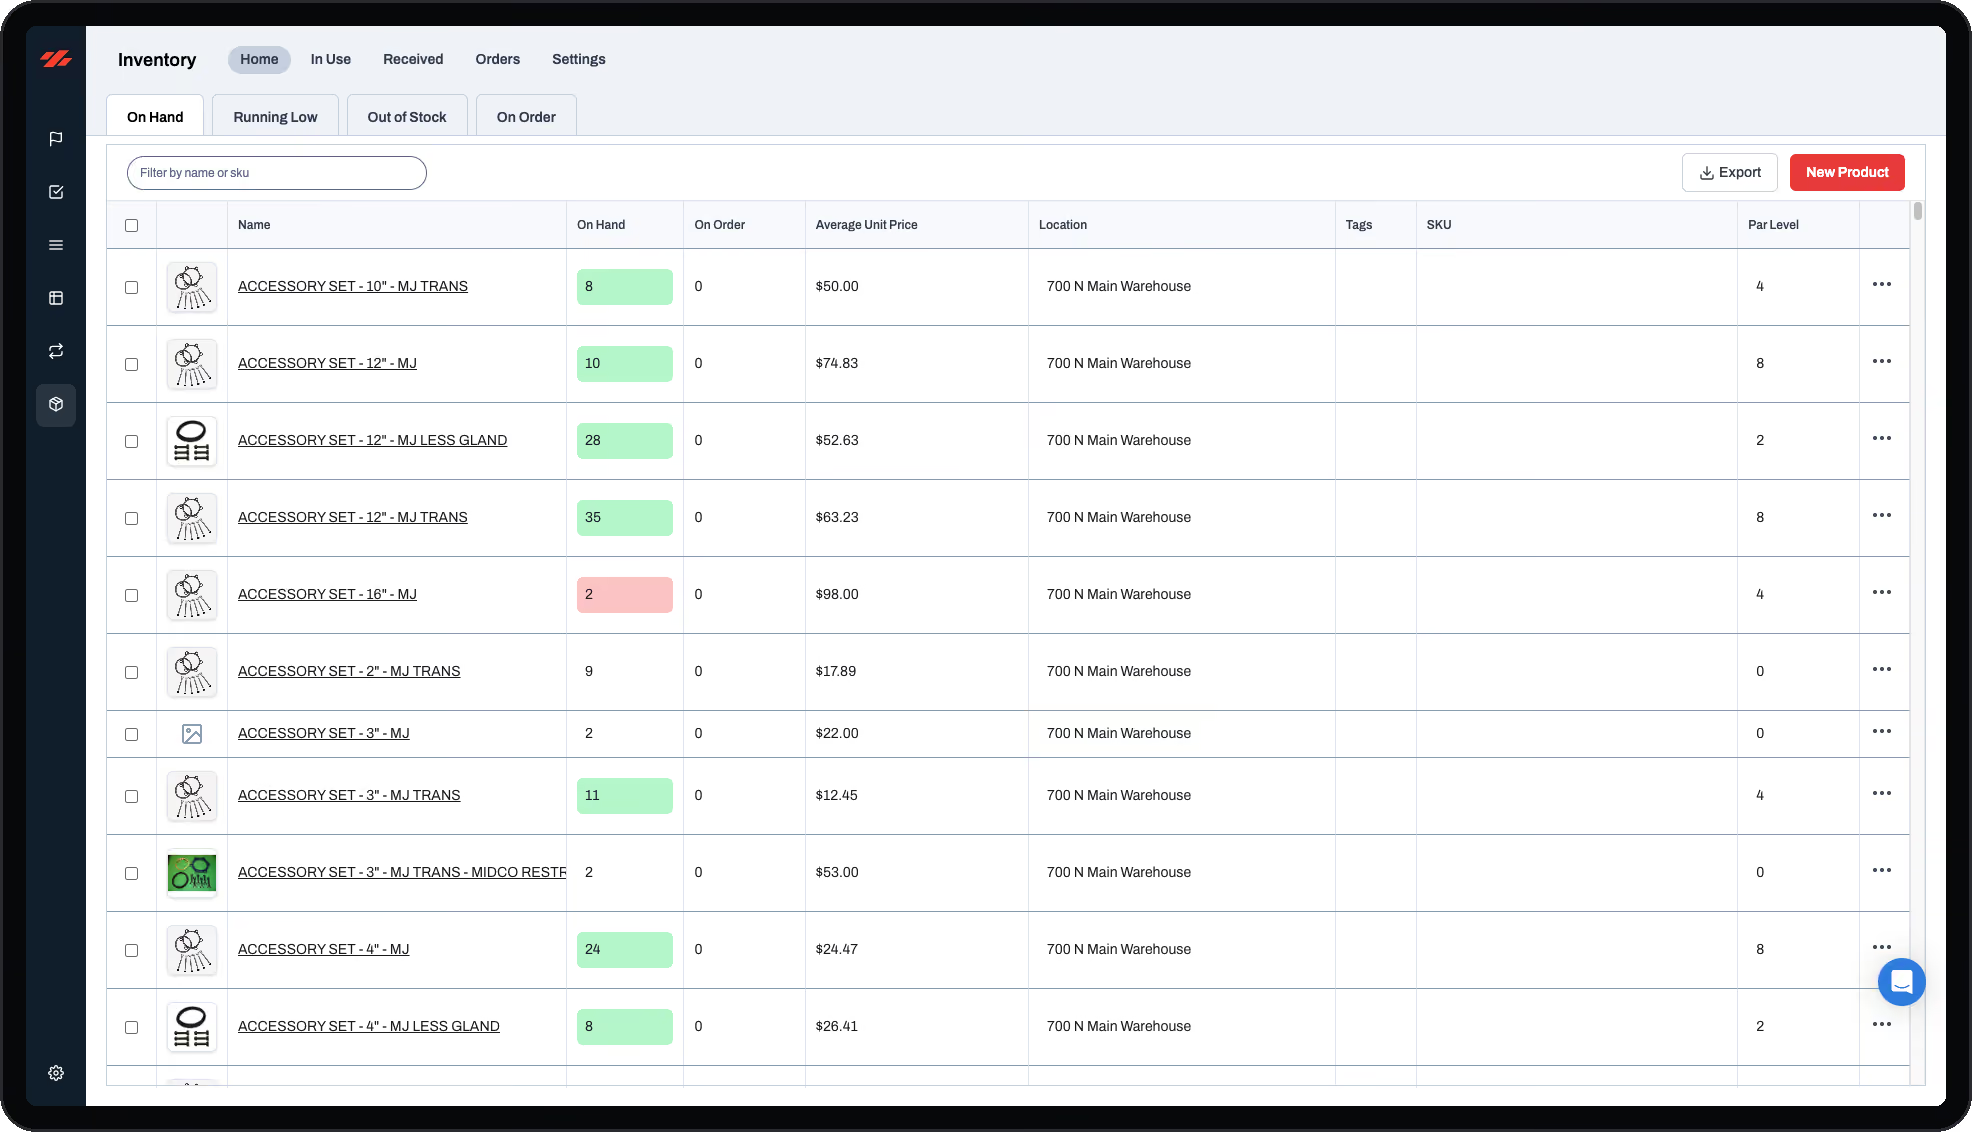
Parts come out of the inventory module at a real unit price, first in, first out. When the crew logs the two fittings and the repair sleeve they pulled, the cost lands on the task. The on-hand count drops so the office knows to reorder.
Equipment.
The backhoe, the vac truck, the trailer each carry an hourly rate. Log the hours and the equipment cost rolls up the same way.
Those three add up to a total cost for that task, and the task is tied to a specific asset on the map. Do that across a year of normal work and you can tap any pipe, pump, or valve and see what it has cost you.
Nobody ran a cost study. The cost history is a byproduct of the work your crew already does, not another project on the pile.
When does it make sense to replace something instead of repairing it again?
When the cost history says so, on one screen.
Repair-or-replace stops being an argument across a table and becomes math you can point at.
Take a force main repaired three times in two years. Every repair is documented: crew hours, parts, equipment, total. On that same asset, the record shows a replacement cost, a condition rating, and a remaining useful life that has gone negative. When the repairs you have already poured in start closing on the replacement cost, the decision makes itself. You are reading a number off the asset, not selling a hunch.
How do I build a capital plan my board will actually fund?
You build it out of records your crew already keeps, not a binder you pay for.
Ziptility carries an asset management plan on every asset. It is the same risk framework an engineer sells as a one-time report. It stays current because the people who touch the infrastructure update it as they work.
That is a plan with a number behind every line, not "we think we need about $150,000." (Salt Creek Services, a 50-connection Indiana system, put it this way: the plan "helped us build our 2023 budget and gave the Board of Directors a clear path of what needs repaired and in what order.")
Do I really need a $30,000 engineer's asset management plan for this?
Less often than you have been told.
The part nobody in the engineering world says out loud: the report is mostly your own data, formatted nicely and shelved. You did the hard part by running the system.
When you genuinely need a formal study, you hand your engineer clean, current data instead of paying them to re-gather what you already had. The engineering judgment stays your engineer's job.
What happens to the binder you already paid for? Asset management walks through it.

For the first time, they can actually see what we've been doing all year.
How do I justify a rate increase to my board?
You make the board argue with the math instead of with you.
For most systems, raising rates only takes a simple board vote. The hard part is not the authority. It is saying why, in front of neighbors who can challenge the number. That is a communications problem, not a money problem.
The barrier was never eligibility. It was that the application itself costs real money to put together. The living record you already keep is most of that application, so the distress that scared you becomes the opening that funds you.
Questions operators ask
Is there a tool that integrates financial tracking with asset management for utilities?
Yes. The cost of a repair (labor, parts, and equipment) attaches to the actual asset on the map when the work order closes. The asset record and its cost history live in one system instead of two.
Does this replace QuickBooks or my accounting system?
No. Keep your accounting software for revenue, payroll, and fund balances. This tracks the one thing the books cannot: what each main, pump, and lift station costs you to keep running. It is infrastructure cost data, not general-ledger accounting.
How do I integrate maintenance tracking with financial accounting?
Track labor hours, parts, and equipment on every work order and tie each one to a specific asset. You get a cost history per asset that feeds your capital plan. Your accounting system keeps doing the books. The two answer different questions.
How do you plan a capital improvement budget for a small water utility?
Line up four numbers on each asset: maintenance spend, replacement cost, criticality, and remaining useful life. Rank by risk and find where repair costs close on the replacement cost. Spread the replacements across three to five years.
How do I justify a rate increase to my board?
Show them the math. The worst-off assets ranked by risk, what each has cost, and what each costs to replace. A rate increase usually only needs a board vote. The hard part is the case, and real numbers make it for you.
Keep reading
More on making the records pay
Three pieces that go further than a product page can, written for whoever has to defend the budget to a board.
How your asset data should drive your capital budget
Replacing what is actually failing, instead of what somebody remembers being old.
Read how the data sets the budgetHow your asset records become a funding application
SRF, grants, and the rate case all ask the same question: can you show your work?
Read what funders ask forCan you connect financial tracking and asset management?
What it takes to know the real cost of a repair, not just the invoice total.
Read how the two connect